Diabetes is a growing global public health concern, with its prevalence expected to affect large populations in the future. Despite the availability of various treatments and therapies, optimal disease control remains elusive1,14,23. In this study, diabetes was induced in rats using alloxan, which mimics insulin-dependent type 1 diabetes by inhibiting insulin-induced glucose secretion and causing pancreatic cell destruction24. Alloxan-induced diabetes can lead to damage in the pancreas and other organs. However, butin, with its anti-inflammatory and anti-apoptotic properties, may offer protective effects on the pancreas and associated organs25,26. The findings of this study demonstrate that butin can enhance glucose metabolism, promote insulin secretion, and improve antioxidant capacity, leading to increased glycogen storage in the liver and muscles. Additionally, in diabetic rats, butin may protect the kidneys from hyperglycemia-induced oxidative stress, thereby preserving kidney function27,28,29.
Effect of butin on weight variation
On the 30th day of the study, both initial and final body weights were measured. The alloxan-induced diabetic rats exhibited a significant decrease in body weight (P < 0.05), while those treated with butin (25 and 50 mg/kg) showed no significant changes in body weight. Furthermore, butin administration significantly mitigated the weight loss observed in the alloxan-induced group (P < 0.0001) (Fig. 1). The weight loss in the alloxan-induced diabetic animals can be attributed to increased glucose utilization and the depletion of glycogen stores24. Additionally, uncontrolled hyperglycemia can lead to dehydration and further weight reduction. These changes in body weight may also result from alterations in food intake, physical activity, and energy expenditure30,31. However, diabetic rats treated with butin maintained their body weight, suggesting a protective effect against the catabolic consequences of diabetes32,33.
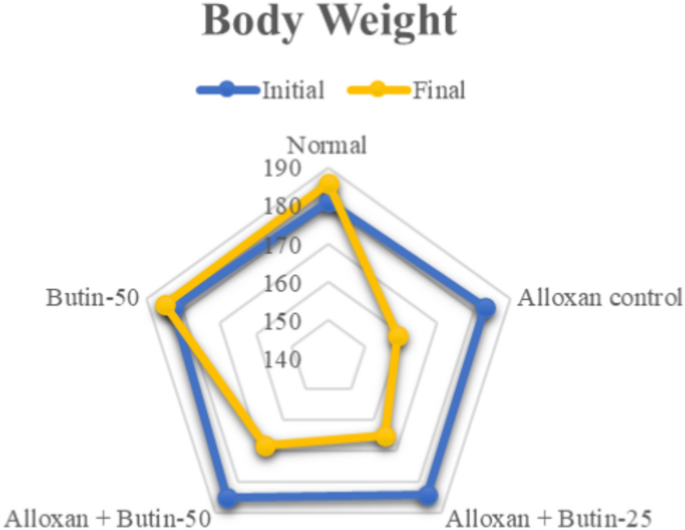
Effect of butin on body weight. Values are expressed in mean (n = 6).
Effect of butin on hemoglobin A1c (Hb1Ac)
Hb1Ac level in the alloxan-induced group was higher (P < 0.01) in association with the normal group. The treatment with butin (25 and 50 mg/kg) led to a significant decrease in Hb1Ac level (F (4, 25) = 53.72, (P < 0.0001)). There was a significant effect of the butin per se group in association with the alloxan-induced group (P < 0.0001) (Fig. 2A).
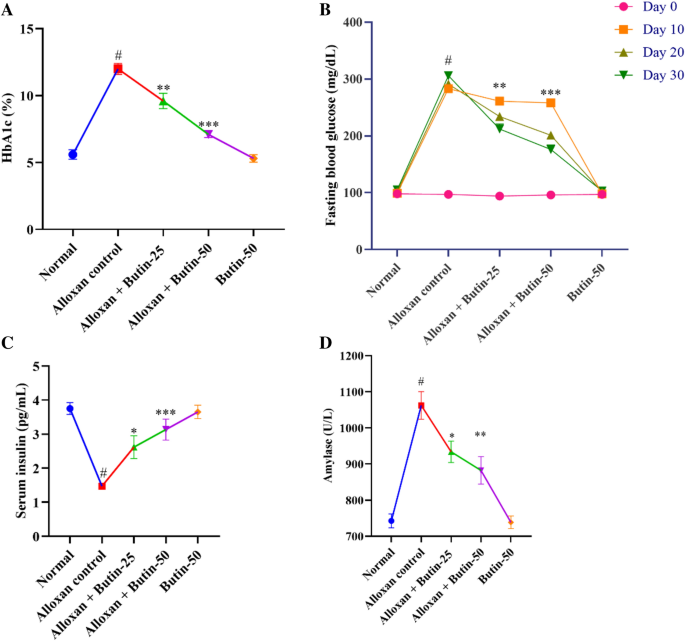
(A–D) Effect of butin on (A) Hb1Ac, (B) blood glucose level, (C) serum insulin level, (D) serum amylase. Values are expressed in mean ± S.E.M. (n = 6). A one-way ANOVA followed applied to Tukey’s post hoc test, #P < 0.01 vs normal group; *P < 0.05, **P < 0.001, ***P < 0.0001 shows statistically significant results vs alloxan control group.
HbA1c is a widely used marker for long-term glucose control in diabetic individuals. A glycated HbA1c results from the non-enzymatic attachment of glucose to hemoglobin’s N-terminal valine residue. Additionally, the degree of glycation in a biosystem is related to blood glucose. In alloxan-induced diabetic rats, HbA1c levels are elevated as a result of persistent hyperglycemia29. However, treatment with butin at both tested doses significantly reduced these elevated HbA1c levels34.
Effect of butin on blood glucose
The fasting blood glucose level was observed to be elevated (P < 0.01) in an alloxan-induced group compared to the normal group. Butin at doses (25 and 50 mg/kg) showed substantial reductions in fasting blood glucose levels (F (4, 100) = 768.8, (P < 0.0001)) in association with the alloxan-induced group at Day 10, 20 and 30. Butin per se had a significant effect on blood glucose levels in the context of the alloxan-induced group (P < 0.0001) (Fig. 2B).
Blood glucose level was significantly elevated in alloxan-induced diabetic rats due to the selective targeting and destruction of pancreatic β cells by alloxan35, and the treatment with butin resulted in a reduction in glucose levels in these diabetic rats.
Effect of butin on insulin levels and amylase
Alloxan-induced rats showed reduced serum insulin and increased amylase levels (P < 0.05) in compared to the normal group. Treatment with butin at doses of 25 and 50 mg/kg significantly restored serum insulin (F (4, 25) = 15.50, (P < 0.0001)) and amylase (F (4, 25) = 155.7, (P < 0.0001)). Butin per se had a significant effect on serum insulin and amylase levels as associated with the alloxan- induced group (P < 0.0001) (Fig. 2C,D).
Insulin and amylase are synthesized by pancreatic β cells, and the destruction of these cells leads to a decrease in insulin levels, resulting in hyperglycemia. Butin, however, appears to exert protective effects on pancreatic β cells, thereby maintaining insulin levels and inhibiting the elevation of amylase, which is crucial for carbohydrate digestion25,36.
Effect of butin on lipid profile
In comparison to the normal group, the alloxan-induced group exhibited a significant increase (P < 0.05) in serum lipid levels, specifically triglyceride (TG), total cholesterol (TC), and high-density lipoprotein cholesterol (HDL) levels. Both doses of butin (25 and 50 mg/kg) significantly reduced TC (F (4, 25) = 67.71, (P < 0.0001)) and TG levels (F (4, 25) = 46.77, (P < 0.0001)) in diabetic animals. In addition, butin administration significantly maintained HDL levels (F (4, 25) = 10.48, (P < 0.0001)) compared to the alloxan-induced group. Butin per se exhibited a significant effect in context to the alloxan-induced group (P < 0.0001) (Fig. 3A–C).
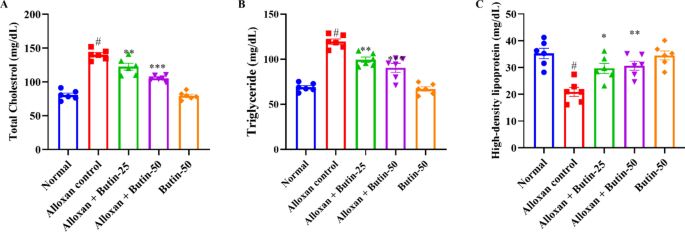
(A–C) Effect of butin on (A) TG, (B) TC, (C) HDL-C. Values are expressed in mean ± S.E.M. (n = 6). A one-way ANOVA followed applied to Tukey’s post hoc test, #P < 0.01 vs normal group; *P < 0.05, **P < 0.001, ***P < 0.0001 shows statistically significant results vs alloxan control group.
Lipid profile in alloxan-induced diabetic rats helps to understand the physiopathology of diabetic dyslipidaemia, and it reflects on the diabetic complication mechanism and reveals possible therapeutic targets. The lipid profile in alloxan-induced diabetic animals can provide valuable insights into the metabolic changes associated with diabetes and the risk of cardiovascular complications37,38. In diabetic conditions, there is a dysregulation of lipid metabolism, leading to alterations in lipid profiles. The lipid levels in alloxan-treated diabetic rats were higher TC, TG and lower HDL levels. However, butin treatment effectively restored a more favorable lipid profile, consistent with findings from studies30,39.
Effect of butin on liver enzymes
The levels of alanine transaminase (ALT) and aspartate transaminase (AST) were remarkably increased (P < 0.001) in the diabetic group compared to the normal group. Treatment with butin at doses of 25 and 50 mg/kg has significantly reduced ALT (F (4, 25) = 68.10, (P < 0.0001)) and AST levels (F (4, 25) = 166.5, (P < 0.0001)) compared to the alloxan-induced group. There was a significant effect in the butin per se group compared to the alloxan-induced group (P < 0.0001) (Fig. 4A,B).
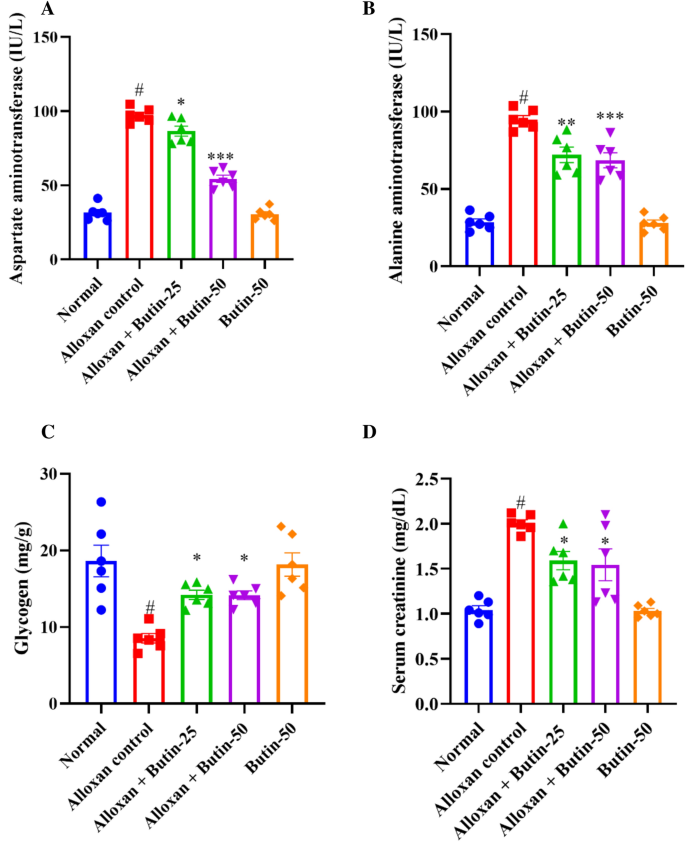
(A–D) Effect of butin on (A) AST, (B) ALT, (C) liver glycogen level, (D) serum creatinine level. Values are expressed in mean ± S.E.M. (n = 6). A one-way ANOVA followed applied to Tukey’s post hoc test, #P < 0.01 vs normal group; *P < 0.05, **P < 0.001, ***P < 0.0001 shows statistically significant results vs alloxan control group.
Elevated ALT and AST levels in the bloodstream can indicate tissue damage, particularly in the liver. Previously reported that alloxan-induced diabetes showed an enhanced level of ALT and AST, indicating hepatic damage resulting in leakage of these hepatic enzymes in the blood, but butin both doses reduced the levels of these hepatic enzymes, providing protection against hepatic damage40.
Effect of butin on glycogen and creatinine levels
As shown in Fig. 4C shows that the concentration of liver glycogen was reduced significantly (P < 0.05) in the alloxan-induced group compared to the normal group. Treatment with butin at doses of 25 and 50 mg/kg significantly increased the liver glycogen levels (F (4, 25) = 10.82, (P < 0.0001)) compared to the alloxan-induced group. The butin per se group significantly affected the context of the alloxan-induced group (P < 0.0001). Furthermore, creatinine was observed to be increased in alloxan-induced rats (P < 0.05) compared to the normal group. The treatment with butin (25 and 50 mg/kg) has significantly reduced the concentration of creatinine (F (4, 25) = 18.53, (P < 0.0001)). The butin per se group had a significant effect in association with the alloxan-induced group (P < 0.0001) (Fig. 4D).
In alloxan-induced diabetes in rats, there were notable alterations in glycogen metabolism and creatinine levels, which are crucial for glucose regulation and kidney function, respectively. The alloxan-induced rats exhibited a decrease in glycogen levels and increased creatinine levels, leading to impaired glucose regulation and kidney damage. Butin treatment substantially restored glycogen and creatinine levels, suggesting its potential to maintain glucose homeostasis and protect against protection against kidney damage40.
Effect of butin on antioxidant enzymes
In Fig. 5A–D, alloxan-induced rats, showed a significant decrease in the levels of superoxide dismutase (SOD), glutathione (GSH), and catalase (CAT), along with a significant increase in malondialdehyde (MDA) levels compared to the normal group (P < 0.05). Butin-treated groups were substantially elevated in the activities of these enzymes i.e., SOD (F (4, 25) = 119.4, (P < 0.0001)), GSH (F (4, 25) = 69.58, (P < 0.0001)), and CAT (F (4, 25) = 49.44, (P < 0.0001)) and reduced the MDA level (F (4, 25) = 92.91, (P < 0.0001)) as compared to alloxan-induced group. The butin per se group also demonstrated a significant effect relative to the alloxan-induced group (P < 0.0001).
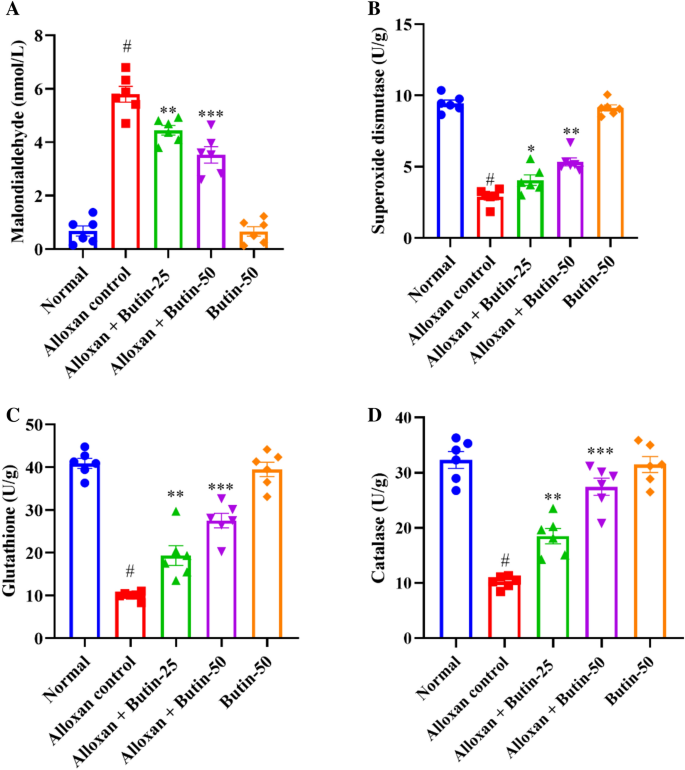
(A–D) Effect of butin on (A) MDA, (B) SOD, (C) GSH, (D) CAT. Values are expressed in mean ± S.E.M. (n = 6). A one-way ANOVA followed applied to Tukey’s post hoc test, #P < 0.01 vs normal group; *P < 0.05, **P < 0.001, ***P < 0.0001 shows statistically significant results vs alloxan control group.
Alloxan-induced diabetes is characterized by increased oxidative stress, driven by the generation of ROS and impaired antioxidant defence mechanisms41. Consequently, alterations in antioxidant markers are commonly observed in animals. In alloxan-induced rats, SOD, GSH, and CAT levels were markedly reduced, while MDA levels were significantly elevated compared to the normal group. Treatment with butin significantly enhanced SOD, GSH, and CAT levels and reduced MDA levels, indicating its potential to mitigate oxidative stress16.
Estimation of pro-inflammatory cytokines
Alloxan-induced diabetes resulted in a significant increase in pro-inflammatory parameters, including tumor necrosis factor-α (TNF-α), interleukin-1β (IL-1β), IL-6, and NF-κB, as assessed by one-way ANOVA. Figure 6A–D shows that alloxan treatment markedly elevated the production of pro-inflammatory markers—TNF-α, IL-1β, IL-6, and NFκB compared to the normal group (P < 0.05). However, treatment with butin at doses of 25 and 50 mg/kg significantly restored the levels of these inflammatory mediators- TNF-α (F (4, 25) = 28.67, (P < 0.0001)), IL-1β (F (4, 25) = 44.66, (P < 0.0001)), IL-6 (F (4, 25) = 22.00, (P < 0.0001)) and NFκB (F (4, 25) = 59.24, (P < 0.0001)) compared to the alloxan-induced group. The butin per se group also demonstrated a significant effect relative to the alloxan-induced group (P < 0.0001).
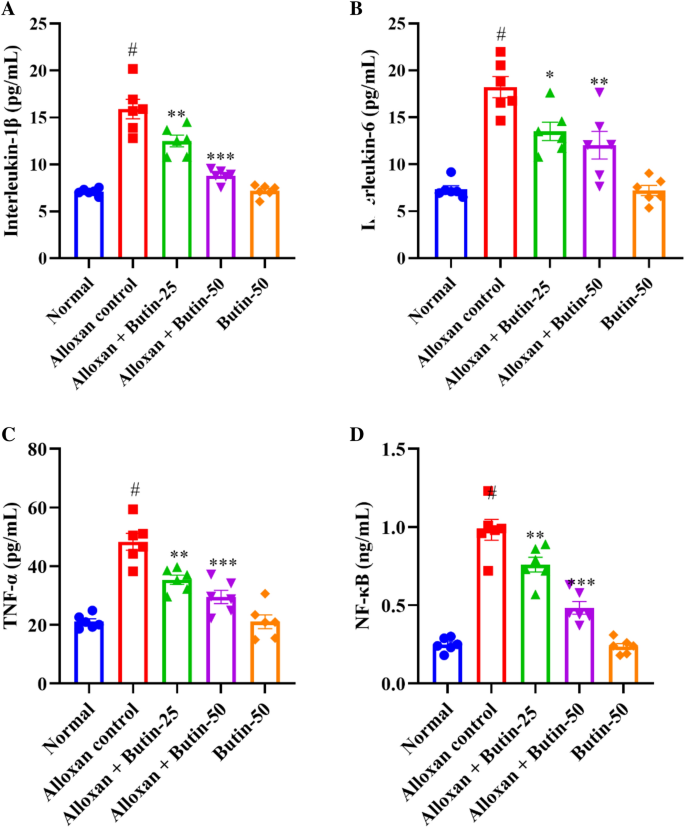
(A–D) Effect of butin on, (A) IL-1β, (B) IL-6, (C) TNF-α, (D) NF-κB. Values are expressed in mean ± S.E.M. (n = 6). A one-way ANOVA followed applied to Tukey’s post hoc test, #P < 0.01 vs normal group; *P < 0.05, **P < 0.001, ***P < 0.0001 shows statistically significant results vs alloxan control group.
Alloxan-induced diabetes in rats is known to cause alterations in the immune system, leading to increased levels of pro-inflammatory cytokines. These inflammatory mediators, including cytokines and chemokines, can exacerbate the destruction of pancreatic β cells42. A significant elevation in inflammation and pro-inflammatory cytokines was observed in alloxan-induced rats43. NF-κB plays a crucial role in regulating immune responses and inflammation, and its levels are elevated in the pancreas and other organs following alloxan administration44,45. In this study, butin effectively restored TNF-α, IL-1β, IL-6, and NF-κB levels in alloxan-induced rats, suggesting that its anti-inflammatory effects may contribute to mitigating diabetes-related complications.
Effect of butin on caspase-3 activity
Caspase-3 activity was significantly upregulated in the alloxan-induced groups (P < 0.05); however, following 30 days of butin administration, caspase-3 activity showed a marked downregulation (F(4, 25) = 106.9, P < 0.0001) compared to the alloxan-induced rats. The butin per se group also demonstrated a significant effect in contrast to the alloxan-induced group (P < 0.0001) (Fig. 7). Caspase-3 is a cysteine protease that regulates apoptosis (programmed cell death) in the cell. In alloxan-induced diabetic rats, elevated glucose levels have been shown to induce oxidative stress, which in turn increases caspase-3 activity, leading to the apoptosis of pancreatic β cells. Previous studies have revealed that high glucose concentrations, as induced by alloxan, contribute to oxidative stress, further damaging β cells and upregulating caspase-3 activity as a marker of apoptosis45,46. This study suggests that butin treatment effectively reduces caspase-3 activity in alloxan-induced diabetic rats, indicating its potential to protect pancreatic β cells from apoptosis47.
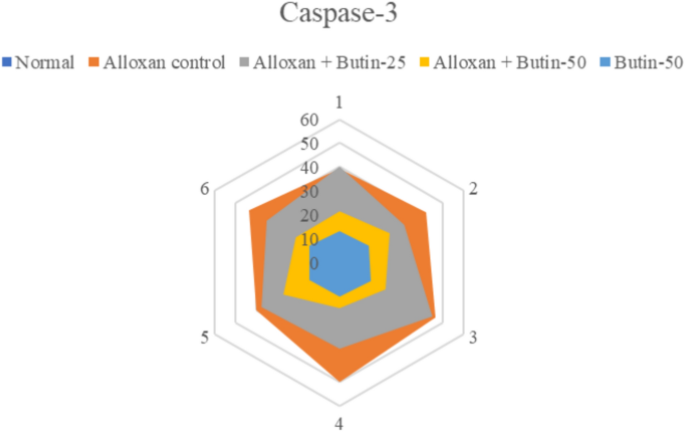
Effect of butin on caspase-3 activity. Values are expressed in mean ± S.E.M. (n = 6).
Histopathological changes in the pancreas
Pancreatic tissues were stained with H&E to evaluate the effects of butin on alloxan-induced pancreatic damage in diabetic rats. The pancreas from the normal and butin 50 mg/kg groups exhibited a normal appearance of the islets of Langerhans and interlobular ducts (Fig. 8A–E). In contrast, pancreas sections from alloxan control animals showed structural abnormalities in the islets of Langerhans and hyperplasia of islet cells (Fig. 8B). Rats treated with butin at 25 and 50 mg/kg for 30 days following alloxan injection demonstrated improvements in the histopathological architecture of the Langerhans islets and interlobular ducts (Fig. 8C,D).
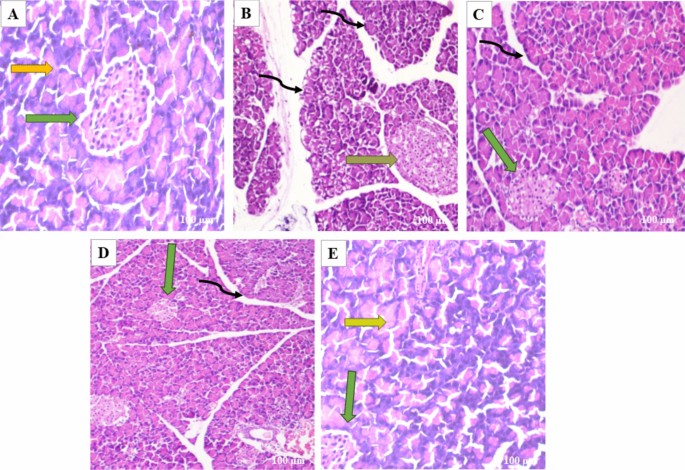
(A–E) In the photomicrographs, the pancreatic tissue sections are stained with H & E at a magnification of × 100 as compared to various experimental groups. (A) The appearance of normal islets of Langerhans (green arrow) and normal intralobular duct (yellow arrow) in normal control rats. (B) Abnormal structure of islet of Langerhans (orange arrow), and disorganized degenerative changes in the nuclei of the acini (black curved arrow) in alloxan control rats. (C) Mild hyperplasia of the islet cells (green arrow) and interlobular duct (black curved arrow) in alloxan + butin-25. (D) Histopathological architecture improved (green arrow) and reorganized interlobular duct (black curved arrow) in alloxan + butin-50. (E) Normal islets of Langerhans (green arrow) and exocrine acini (yellow arrow) exhibited in butin-50.
Histopathological analysis of diabetic rats revealed severe necrosis and distortion of pancreatic tissue48. However, administration of butin to alloxan-induced diabetic rats resulted in the normalization of the Langerhans islets. These observations collectively suggest that butin offers protective effects on pancreatic tissues, reducing the extent of damage in alloxan-induced diabetic rats49.
Molecular docking and dynamic simulation
In the in-silico study, three proteins, i.e., caspase-3, serum insulin, and NF-κB, were selected based on empirical evidence from our in vivo studies, which demonstrated significant biological interactions between butin and these targets. To further elucidate the molecular mechanisms underlying these interactions, in silico analyses were conducted. This computational approach allowed us to explore the molecular-level interactions between butin and these specific targets, providing a deeper understanding of their binding interactions and potential therapeutic implications.
The molecular docking study revealed that butin exhibits significant binding interactions with 1NME (caspase-3), 1SVC (NF-κB), and 4IBM (serum insulin), with binding affinities of − 7.4, − 6.5, and − 8.2 kcal/mol, respectively (Fig. 9). These findings suggest that butin may be a promising therapeutic agent capable of targeting caspase-3, NF-κB, and serum insulin in alloxan-induced diabetes, offering potential benefits in the management of the disease50,51,52.
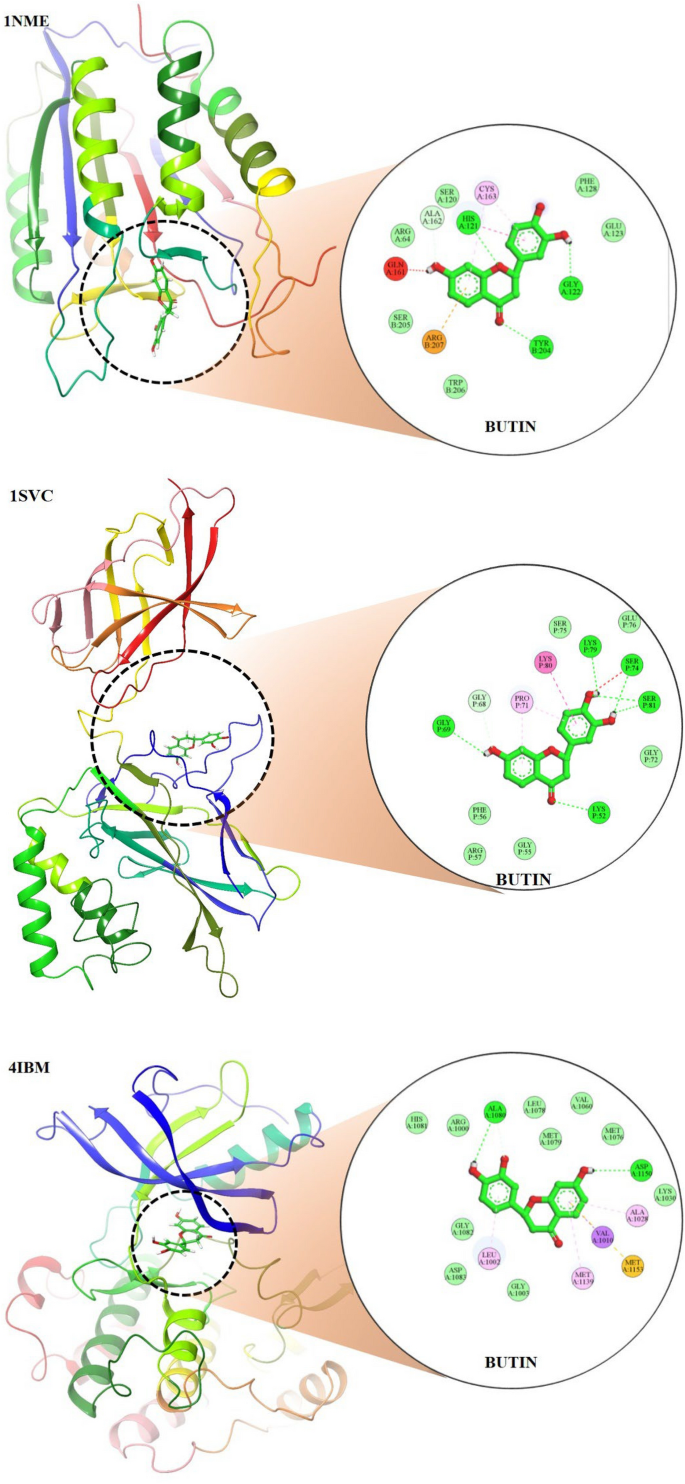
Molecular docking 2D and 3D images of the butin with proteins Caspase-3(1NME), NFKβ (1SVC) and Serum Insulin (4IBM).
The stability and convergence of the Apo-4IBM and 4IBM + Butin complexes were investigated using molecular dynamics simulation (MDS). When comparing the root mean square deviation (RMSD) data, a simulation of 200 ns revealed stable conformation. The average RMSD of the Cα-backbone of Apo-4IBM exhibited 2.58 Å and a deviation of 0.36686 Å, which is relatively small. Moreover, the RMSD average is below 3 Å (Fig. 10A(i)). RMSD clustering matrix analysis with frequency 10 of trajectory clusters exhibited 12 distributed clusters with few overlapping sampling. 4IBM + Butin complex, on the other hand, exhibited an average RMSD of Cα-backbone from the triplicate of 2.60 Å (Fig. 10B(i)) having a standard deviation of 0.38 Å (Table 1). The best two clusters with high conformations are analyzed by superimposing their conformational structures. The best two clusters where RMS deviation was observed to be 0.81 Å (Table 1) with a small change in conformation at the extended loop region (marked arrow Fig. 10C(i)).
Plots of triplicate run displaying RMSD for Cα-backbone of (A(i)) 4IBM_Apo, (B(i)) 4IBM bound with Butin, (A(ii)) 1NME_apo, (B(ii)) 1NME bound with Butin, (A(iii)) 1SVC_Apo, (B(iii)) 1SVC bound with Butin, superimposed two best clusters (C(i)) 4IBM_apo, (C(ii)) 1NME_apo, (C(iii)) 1SVC_apo displaying the residues of the positions for which RMS deviation occur. Superimposed best RMSD cluster of Apo and Butin bound to (D(i)) 4IBM, (D(ii)) 1NME (displaying the loop arrangement during simulation), (D(iii)) orientation of binding cavity of best apo cluster and Butin bound cluster of 1SVC. RMSF plots of Cα-backbone of triplicate run for (E(i)) 4IBM_apo, (F(i)) 4IBM bound to butin, (E(ii)) 1NME_apo, (F(ii)) 1NME bound with butin, (E(iii)) 1SVC apo and (F(iii)) 1SVC bound to butin. Radius of gyration plots of Cα-backbone of triplicate run for (G(i)) 4IBM_apo, (H(i)) 4IBM bound to butin, (G(ii)) 1NME_apo, (H(ii)) 1NME bound with butin, (G(iii)) 1SVC apo and (H(iii)) 1SVC bound to butin. Average hydrogen bonds from triplicate simulation run for (I(i)) 4IBM, (I(ii)) 1NME and (I(iii)) 1SVC.
The conformational deviation from RMSD cluster analysis of best cluster conformation from 4IBM + Butin and Apo-4IBM exhibited a RMS Deviation of 1.9 Å (Fig. 10D(i)). No significant conformational deviation occurs at the ligand butin binding cavity, while the extended loop of the side chain exhibited a small conformational deviation (Fig. 10D(i)), arrow marked). Therefore, from the clustering analysis, RMS deviations are observed to be less, exhibiting less conformational deviation and converged structures during simulation. The average RMSD of the Cα-backbone of Apo-1NME exhibited 2.004 Å and a deviation of 0.575385 Å, which is relatively small. Moreover, the RMSD average is below 3 Å (Fig. 10A(ii)). RMSD clustering matrix analysis with frequency 10 of trajectory clusters exhibited 10 distributed clusters with few overlapping sampling. The best two clusters with high conformations are analyzed by superimposing their conformational structures. Figure 10B(ii) shows the RMSD average of 1NME bound with butin. Figure 10C(ii) exhibited the best two clusters where RMS Deviation was observed to be 0.55 Å (Table 1). It was observed that the terminal residues Ser29, Gly30, Ile31, Ser32 and Leu33 are oriented in opposite directions to achieve the structures’ convergence. Whereas 1NME bound to Butin has exhibited an average RMSD of 2.009 Å and a deviation of 0.240691 Å. The overall deviation has been reduced as compared to apo form in ligand bound state. Clustering analysis of the conformers exhibited 17 distributed clusters, and the best cluster having the highest conformers was superimposed with the best cluster of apo for exhibiting the loop formation improving flexibility (Fig. 10D(ii)) in Butin bound state where the apo form conforms a helical turn. Thus, the ligand-bound structure exhibited more flexible conformation in order to accommodate the ligand.
The average RMSD of the Cα-backbone of Apo-1SVC3 exhibited 4.01 Å and a deviation of 1.430185 Å, which is relatively small (Fig. 10A(iii)). RMSD clustering matrix analysis with frequency 10 of trajectory clusters exhibited 12 distributed clusters with few overlapping sampling. The best two clusters with high conformations are analyzed by superimposing their conformational structures (Fig. 10B(iii)). There are no marked differences observed among the best two cluster conformers (Fig. 10C(iii)), while the butin bound 1SVC3 exhibited similarly as displayed for Apo bound state 4.01 Å and a deviation 1.430185 Å (Table 1). RMSD clustering exhibited a deviation of the loop orientation at the binding pocket of butin where the pocket was much straighter in apo form while in the ligand-bound state, more pulled toward the ligand for better accommodation of butin (Fig. 10D(iii)).
The root mean square fluctuations (RMSF) plots provide insight into the flexibility of residues within a protein structure. In the case of the Apo-4IBM complex, the RMSF plot reveals notable fluctuations at specific residue positions, particularly at positions 40, and in the ranges of 110–125 and 170–190, where the fluctuation exceeds 3 Å (Fig. 10E(i)). These fluctuations suggest a degree of flexibility in the side chain residues at these positions, indicating potential regions of conformational variability within the protein structure. To quantify the overall fluctuation across the entire trajectory of the Apo-4IBM simulation, the average RMSF is computed. The average RMSF over the entire trajectory from triplicate runs is calculated to be 1.54 Å, with a standard deviation of 0.117 Å (Table 1). This value provides a measure of the typical fluctuation observed throughout the simulation, indicating the overall dynamic behavior of the protein. Upon binding of the ligand to the 4IBM complex, changes in RMSF patterns can be observed. The average RMSF in the ligand-bound 4IBM complex is recorded to be 1.28 Å, indicating a reduction in overall fluctuation compared to the Apo state. Specific residue positions exhibit higher fluctuations in the ligand-bound state, notably at positions 40 and in the range of 115–125 (Fig. 10F). However, the fluctuations observed in the range of positions 170–190, which were prominent in the Apo state, diminish in the ligand-bound state. This suggests that the binding of the ligand induces structural stabilization in the protein, leading to reduced flexibility overall, except for a few specific flexible regions influenced by the ligand binding. RMSF plot of 1NME-Apo and butin exhibiting the high fluctuating peak at residues between 140 and 150 and the rest residues are less fluctuating (Fig. 10E(ii),E(iii)). This indicates the flexible residues between 140 and 150 positions might be involved in forming the loops, and the rest of the protein is rigid in both ligand-bound and unbound states. RMSF analyses of 1SVC3-apo and 1SVC3-butin complexes exhibited a series of fluctuating residues. In 1SVC3-apo, major fluctuations are observed from 21–40, 140–155, 245–257, 259–276, and 277–290 residues (Fig. 10E(iii)) while butin bound complex exhibited the lowering of the fluctuating residues as compared to the apo form (Fig. 10F(iii)). This indicates that the flexibility of the residues in the apo form might be due to loop arrangements, which perhaps conformed in other secondary structures at ligand-bound state. In summary, the RMSF analysis provides valuable insights into the dynamic behavior of the protein structure in both the Apo and ligand-bound states. The observed fluctuations indicate regions of flexibility and rigidity within the protein, with changes in RMSF patterns upon ligand binding reflecting alterations in protein dynamics and stability. The radius of gyration (RoG) serves as a crucial metric for assessing the compactness of a protein structure. A lower RoG value indicates a more compact orientation of the protein, suggesting tighter packing of its constituent residues. In the context of this study, the RoG analysis provides insights into the structural dynamics of the Apo-4IBM and butin-bound 4IBM complexes. For the Apo-4IBM complex, the triplicate runs of trajectories spanning 200 ns demonstrate a stable RoG profile (Fig. 10G(i)). This stability indicates that the protein structure has reached a converged state and is properly folded, as evidenced by the consistent RoG values observed throughout the simulation. The average RoG value for the Apo-4IBM complex is recorded to be 20.01 Å, with a standard deviation of 0.244 Å (Table 1). This value represents the typical compactness exhibited by the protein in its unbound state. In contrast, the butin-bound 4IBM complex displays a similarly stable RoG profile across all triplicate sets (Fig. 10H(i)). The RoG values for the butin-bound complex are consistently lower compared to the Apo state, indicating a higher level of compactness induced by the binding of the ligand. The average RoG for the butin-bound 4IBM complex is calculated to be 19.61 Å, with a smaller standard deviation of 0.077 Å (Table 1). This tighter packing of the protein structure in the presence of the ligand suggests a more compact conformation adopted upon ligand binding. In the case of 1NME-apo, the RoG plot exhibited the lowering pattern in the 1st run, while the couple of runs of the triplicate exhibited the stable pattern (Fig. 10G(ii)). The average RoG value is calculated from the triplicate runs 17.84 Å with a standard deviation 0.042575 Å (Table 1). In comparison, 1NME complexed with butin exhibited small lowering patterns of all the 3 replicates (Fig. 10H(ii)). The average RoG value is calculated from the triplicate runs 17.98 Å with a standard deviation 0.056028 Å (Table 1). On the other hand, 1SVC3-Apo and butin bound structures exhibited lowering pattern (Fig. 10H(iii)) in both cases and average RoG is calculated as 23.78 Å with a standard deviation 0.741294 Å (Table 1). Comparing the RoG values between the Apo and butin-bound structures provides valuable insights into the structural changes induced by ligand binding. The significantly lower RoG values observed in the butin-bound complex indicate a more compact orientation of the protein compared to its unbound state. This finding underscores the stabilizing effect of ligand binding on the protein structure, leading to a tighter and more compact conformation. Overall, the RoG analysis highlights the structural alterations accompanying ligand binding and provides quantitative evidence of the resulting changes in protein compactness. The number of hydrogen bonds between protein and ligand suggests the significant interaction and stability of the complex. Butin bound to 4IBM, 1NME and 1SVC exhibited an average of 1.14, 1.54, and 1.59 hydrogen bonds respectively signifying butin shows stable interaction between them (Fig. 10I(i)). However, 1NME and 1SVC bound state exhibited good hydrogen bond interaction as compared to 4IBM (Fig. 10I(ii),I(iii)).
Molecular mechanics generalized born surface area (MM-GBSA) calculations
Utilizing the MD simulation trajectory, the binding free energy along with other contributing energy in form of MM-GBSA were determined for 4IBM with Butin complex. The results (Table 1) suggested that the maximum contribution to ΔGbind in the stability of the simulated complex were due to ΔGbindCoulomb, ΔGbindvdW and ΔGbindLipo, while, ΔGbindCovalent and ΔGbind SolvGB contributed to the instability of the 4IBM with Butin complex complex and the average binding energy from the triplicate run is calculated as − 37.5067 ± 4.89 kcal/mol (Table 2). However, significant contribution exhibited by ΔGbindCovalent and ΔGbindSolv imparts negative effect on butin binding with the protein (Table 2). Therefore, MMGBSA calculation supported the potential of butin ligand having high affinity of binding to the protein as well as efficiency in binding to the selected protein and the ability to form stable protein–ligand complex.
The average binding energy from the triplicate run is calculated as − 15.3867 ± 8.65 kcal/mol (Table 3). However, the significant contribution exhibited by ΔGbindCovalent and ΔGbindSolv negatively affects butin binding with the protein (Table 3). Therefore, from MMGBSA calculation supported the potential of butin ligand having high affinity of binding to the protein as well as efficiency in binding to the selected protein and the ability to form stable protein–ligand complex. The average binding energy from the triplicate run is calculated as − 13.5633 ± 2.85 kcal/mol (Table 4). However, the significant contribution exhibited by ΔGbindCovalent and ΔGbindSolv imparts a negative effect on butin binding with the protein (Table 4). Therefore, MMGBSA calculation supported the potential of the butin ligand having a high affinity of binding to the protein as well as efficiency in binding to the selected protein and the ability to form a stable protein–ligand complex.
Figures 11 and 12 represent ligand interactions with residues of 1NME (Top), 1SVC (Middle), and 4IBM (Bottom) over the period of simulation and ligand atoms’ interaction with residues of proteins 1NME (Top), 1SVC (Middle), and 4IBM (Bottom) occurs more than 10% of the simulation time 200 ns. Investigation of the simulation study of butin presented water bridge, H-bonding hydrophobic interactions within stable regions of proteins. Butin interacted with 1NME at residue Ser104, Glu106, Asp107, Asp146, and Ser150 through water bridge and hydrogen bonding, while with residues Lys106, Arg147, and Arg147 through water bridge, hydrogen bonding, and hydrophobic interactions. Butin interacted with 1MNE at residue Glu106, Ser150, and Asp146 at 18%, 27%, and 17%, respectively, through hydrogen bonds, while with Arg147 at 10% through hydrophobic interactions.
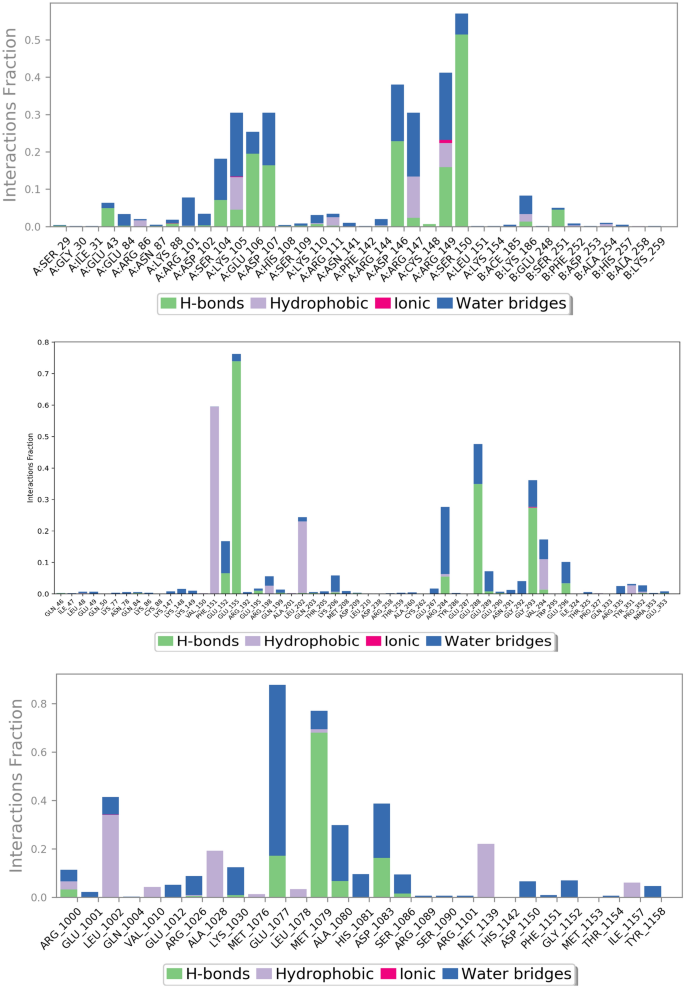
The plot represents ligand interactions with residues of 1NME (Top), 1SVC (Middle), and 4IBM (Bottom) over the period of simulation.

The schematic of detailed ligand atoms’ interaction with residues of proteins 1NME (Top), 1SVC (Middle), and 4IBM (Bottom) occurs more than 10% of the simulation time 200 ns.
With protein 1SVC, butin interacted at residue Glu155, Glu152, Arg284, Glu288, Gly293, and Glu296 through water bridges and H-bonding, while with Phe151 through hydrophobic interaction. Butin exhibits 25% interaction with Gly293, 34% interaction with Glu288, 73% interaction with Glu155 through hydrogen bonding, 26% interaction with Arg284 through water bridges, and 10% interaction with Phe151 through pi-pi stacking with protein 1SVC.
Butin interacted with protein 4IBM at residues Leu1002 through hydrophobic and water bridges, with Ala1028 and Met1139 through hydrophobic interaction, while with Glu1077, Met1079, Ala1080, and Asp1083 through water bridge and H-bonds. Butin exhibits 62% interaction with Met1079 through hydrogen bonding, 54% interaction with Asp1083, 150% interaction with Glu1077 through water bridges and hydrogen bonding, 22% interaction with Lys1030, and 26% interaction with Ala1080 through water bridges with 4IBM.
The mentioned amino acids that interact with ligands have a significant role in the active site and play an important role in the stability of butin with selected targets. The study suggests that butin interacts with all targets through a hydrogen bonds-water bridge network with significant frequencies. In addition, the figure shows that butin interacted better with 1SVC and 4IBM than 1NME, as concluded from the percentage interactions found between ligands and residues. This suggests that butin binds with 1NME and 1SVC mostly through hydrogen bonding, while with 4IBM through the water bridges-h-Bond network.
The comparison between the protein–ligand contacts during the course of simulation and initial docking studies of 1NME with butin and 1SVC with butin reveals a notable disparity in interaction persistence and type of interaction (Fig. 13). Trajectory analysis shows diverse and dynamic interaction profiles across the simulation period with a significant number of interactions. This dynamic nature shows the ability of the simulation study to capture transient and stable interactions that are relevant over the simulation period. However, docking studies demonstrate a more constrained interaction landscape, initially dominated by few interactions, which shows that docking provides initial insight into potential binding modes50. When we compare the MD study protein–ligand interaction of the 4IBM_butin complex with its initial docking study, it has been found that the docking study provides a foundational propensity for hydrogen bonding and hydrophobic interactions, often underrepresented statically51. However, in the MD simulations, a more nuanced interaction landscape emerges, characterized by an enhanced prevalence of hydrophobic interactions and the critical role of water bridges in stabilizing the complex53. This not only supports the transient nature of molecular interactions but also highlights the importance of considering solvent effects and dynamic changes over the period of simulation time. Such findings support the integration of MD simulations to achieve a more comprehensive understanding of protein–ligand interaction54,55,56.

Timeline representation of the interaction of butin with residues of proteins 1NME (First), 1SVC (Middle), and 4IBM (Last) in each trajectory frame over the period of simulation.
The results of this study suggest that butin treatment may influence additional pathways to control blood glucose and modulate diabetes pathogenesis in rats (Fig. 14). However, further research is required to establish whether butin is a viable therapeutic agent for diabetes and to elucidate its effects on insulin and glucose regulation in alloxan-induced diabetic rats.
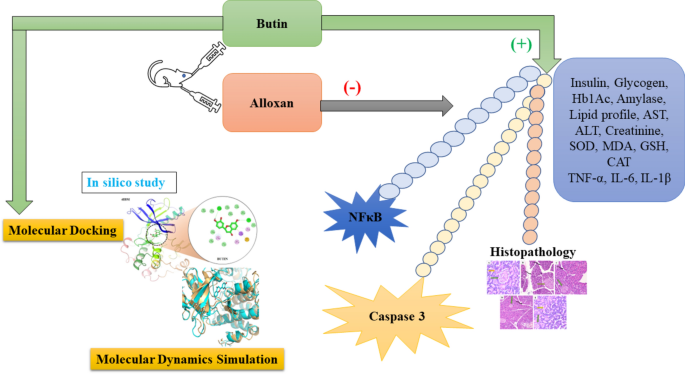
Proposed mechanism of butin against alloxan-induced diabetic rats.
The study also has several limitations that could affect the interpretation and reliability of the findings. These include constraints related to the use of small animal models, variability in Western blot results, and challenges associated with immunohistochemistry.


