Characterization and expression profile of the extracted RNAs
For spectrophotometer, the OD A260/A280 ratios of the samples vary from 1.87 to 1.99, and the OD A260/A230 ratios range from 1.85 to 2.41. All samples had sufficient sequence counts and quality for the following analysis (Table S3). RNA Integrity and gDNA contamination were tested by Denaturing Agarose Gel Electrophoresis (Figure S1). Based on the strict quality control, a total of 1598 tsRNAs were identified in the subcutaneous adipose tissue samples.
Differentially expressed tsRNAs identified in mice subcutaneous adipose tissue
To further explore the differentially expressed tsRNAs in the four groups, we performed pairwise comparisons among the samples, and the identification criteria of differential expression were a fold change (FC) ≥ 1.5 or ≤ 0.67 (p < 0.05). As was shown in Table S4, a total of 37 up-regulated tsRNAs and 18 tsRNAs were identified in HFVDD vs. HFVDS (Fig. 1A). 34 up-regulated tsRNAs and 50 down-regulated tsRNAs were identified in HFVDD vs. ConVDD (Fig. 1B). 55 up-regulated tsRNAs and 101 down-regulated tsRNAs were identified in HFVDD vs. ConVDS (Fig. 1C). 84 up-regulated tsRNAs and 131 down-regulated tsRNAs were identified in HFVDS vs. ConVDD (Fig. 1D). 54 up-regulated tsRNAs and 76 down-regulated tsRNAs were identified in HFVDS vs. ConVDS (Fig. 1E). 18 up-regulated tsRNAs and 25 down-regulated tsRNAs were identified in ConVDD vs. ConVDS (Fig. 1F).
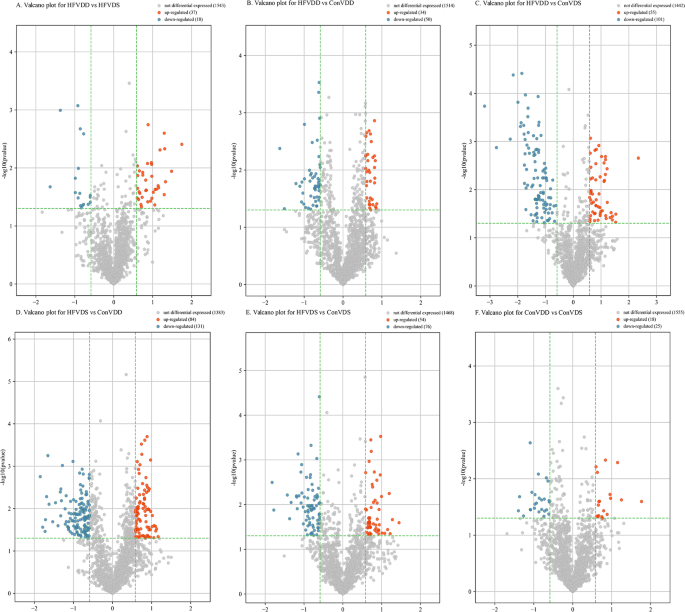
Valcano plot. A: Valcano plot for HDVDD vs. HFVDS; B: Valcano plot for HFVDD vs. ConVDD; C: Valcano plot for HFVDD vs. ConVDS; D: Valcano plot for HFVDS vs. ConVDD; E: Valcano plot for HFVDS vs. ConVDS; F Valcano plot for ConVDD vs. ConVDS.
Between-group comparisons of the differentially expressed tsRNAs in VD deficiency mice with or without obesity by high-throughput sequencing technology
We listed the top 10 tsRNAs with the most significantly differential expression in each group according to the FCs (Table 1). 5 tsRNAs (tRF5-20-HisGTG-3, tRF5-22-CysGCA-27, tRF5-20-CysGCA-27, 5’tiRNA-36-ValAAC-3, tRF5-18-CysGCA-27) were highly expressed and 10 tsRNAs (mt-5’tiRNA-33-AlaTGC, mt-5’tiRNA-33-SerTGA, mt-5’tiRNA-32-SerTGA and mt-tRF3a-ProTGG, mt-5’tiRNA-38-LeuTAA, mt-5’tiRNA-31-GluTTC, mt-5’tiRNA-36-LeuTAA, mt-tRF3b-TrpTCA, mt-5’tiRNA-37-LeuTAA, mt-5’tiRNA-32-TrpTCA) were low expressed not only in HFVDD vs. HFVDS, but aslo in HFVDD vs. ConVDS. 5 tsRNAs (tRF3a-GlyGCC-1, 3’tiRNA-50-SerGCT-1, tRF3b-SerGCT-1, tRF3a-ThrAGT-5, 3’tiRNA-41-GlyGCC-6) were highly expressed only in HFVDD vs. ConVDS.
Between-group comparisons of the selected differentially expressed tsRNAs in VD deficiency mice with or without obesity verified by RT-PCR
In the next step, in order to validate the differential expression, 2 high candidate tRFs (tRF5-20-HisGTG-3 and tRF5-22-CysGCA-27) and 4 low candidate tRFs (mt-5’tiRNA-33-AlaTGC, mt-5’tiRNA-33-SerTGA, mt-5’tiRNA-32-SerTGA and mt-tRF3a-ProTGG) not only in HFVDD vs. HFVDS, but aslo in HFVDD vs. ConVDS were measured by RT-PCR. 1 high candidate tRFs (tRF3a-GlyGCC-1) in HFVDD vs. ConVDS was measured by RT-PCR. RT-PCR verification further demonstrated that 1 tsRNAs (tRF5-20-HisGTG-3, P < 0.05, Fig. 2A) was significantly up-regulated and 1 tsRNA (mt-tRF3a-ProTGG, P < 0.05, Fig. 2F) was significantly down-regulated not only in HFVDD vs. HFVDS, but aslo in HFVDD vs. ConVDS. 1 tsRNAs (tRF5-22-CysGCA-27, P < 0.05, Fig. 2B) was significantly up-regulated and 3 tsRNA (mt-5’tiRNA-33-SerTGA, mt-5’tiRNA-32-SerTGA, and mt-5’tiRNA-33-AlaTGC, all P < 0.05, Fig. 2D, E and C) were significantly down-regulated only in HFVDD vs. ConVDS.
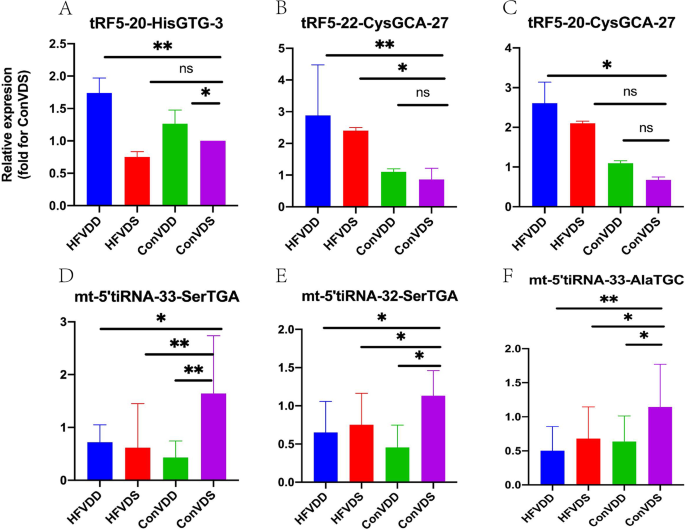
Between-group comparisons of the selected differentially expressed tsRNAs in VD deficiency mice with or without obesity verified by RT-PCR. A: tRF5-20-HisGTG-3; B: tRF5-22-CysGCA-27; C: mt-5_tiRNA-33-AlaTGC; D: mt-5_tiRNA-33-SerTGA; E: mt-5_tiRNA-32-SerTGA; F:mt-tRF3a-ProTGG.
GO enrichment, KEGG pathway analyses, and associated target genes of the candidate tsRNAs
The functional annotation of candidate tsRNAs were performed as previously described. The biological processes (BP) terms including cellular process, biological regulation, cellular metabolic process, regulation of biological process, regulation of cellular process, metabolic process, primary metabolic process, organic substance metabolic process, nitrogen compound metabolic process, cellular macromolecule metabolic process were found to highly enriched in the target genes of 3 up-regulated tsRNAs (Fig. 3A). The BP terms including cellular process, biological regulation, regulation of biological process, regulation of cellular process, cellular metabolic process, multicellular organismal process, response to stimulus, metabolic process, primary metabolic process, cell communication were found to highly enriched in the target genes of 4 down-regulated tsRNAs (Fig. 3D). The cellular components (CC) terms including cellular anatomical entity, intracellular, organelle, intracellular organelle, membrane − bounded organelle, intracellular membrane − bounded organelle, cytoplasm, membrane, nucleus, intrinsic component of membrane were found to highly enriched in the target genes of 3 up-regulated tsRNAs (Fig. 3B). The CC terms including cellular anatomical entity, intracellular anatomical structure, organelle, intracellular organelle, membrane, membrane − bounded organelle, intracellular membrane − bounded organelle, cytoplasm, integral component of membrane, intrinsic component of membrane were found to highly enriched in the target genes of 4 down-regulated tsRNAs (Fig. 3E). The molecular functions (MF) terms including binding, protein binding, on binding, heterocyclic compound binding, organic cyclic compound binding, cation binding, metal ion binding, catalytic activity, enzyme binding, identical protein binding were found to highly enriched in the target genes of 3 up-regulated tsRNAs (Fig. 3C). The MF terms including binding, protein binding, ion binding, metal ion binding, cation binding, organic cyclic compound binding, heterocyclic compound binding, catalytic activity, molecular transducer activity, signaling receptor activity were found to highly enriched in the target genes of 4 down-regulated tsRNAs (Fig. 3F).
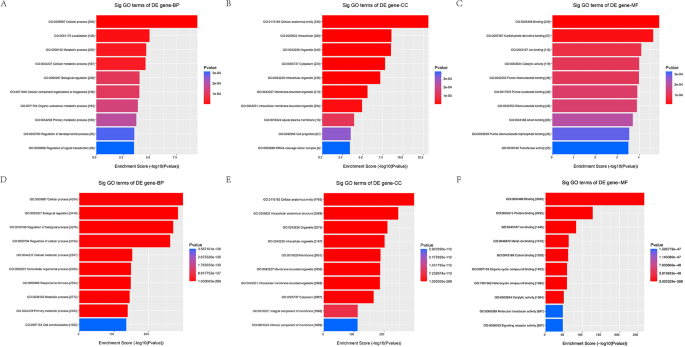
The BP, CC and HF of uptsRNA(A, B,C) and the down tsRNA(D, E,F). A: the BP of uptsRNA; B: the CC of uptsRNA; C: the HF of uptsRNA; D: the BP of the down tsRNA; E: the CC of the down tsRNA; F: the HF of the down tsRNA.
The top 10 significant pathways of candidate tsRNA were shown in Fig. 4. It was demonstrated that the 3 up-regulated tsRNAs seemed to be most strongly associated with melanoma, breast cancer, chronic myeloid leukemia, FoxO signaling pathway glioma, autophagy-animal, hypertrophic cardiomyopathy, axon guidance, endocrine resistance, PD-L1 expression and PD-1 checkpoint pathway in cancer (Fig. 4A). By contrast, 4 down-regulated tsRNAs seemed to be most strongly associated with olfactory transduction, colorectal cancer, sphingolipid signaling pathway, cushing syndrome, gap junction, wnt signaling pathway, melanogenesis, proteoglycans in cancer, long − term depression, adherens junction (Fig. 4B).
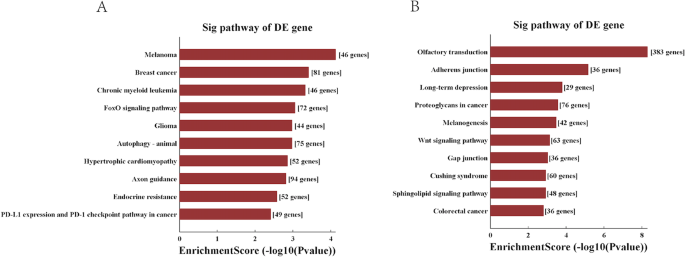
The Sig pathway of DE gene in the up tsRNA (A) and the down tsRNA(B). A: the Sig pathway of DE gene in the up tsRNA; B: the Sig pathway of DE gene in the down tsRNA;.
TargetScan and Miranda were used to predict the target genes of the qPCR-verified DE tsRNAs. There were 403, 330, 4182, 4425, 4324 and 2564 targeted genes of tRF5-20-HisGTG-3, tRF5-22-CysGCA-27, mt-5’tiRNA-33-AlaTGC, mt-5’tiRNA-33-SerTGA, mt-5’tiRNA-32-SerTGA and mt-tRF3a-ProTGG, respectively. The top 20 potential targeted genes of tRF5-20-HisGTG-3, tRF5-22-CysGCA-27, mt-5’tiRNA-33-AlaTGC, mt-5’tiRNA-33-SerTGA, mt-5’tiRNA-32-SerTGA and mt-tRF3a-ProTGG, respectively were listed in Table 2. The co-expression network of the top 20 target genes and differential tsRNA is shown in Fig. 5A and Fig. 5B.
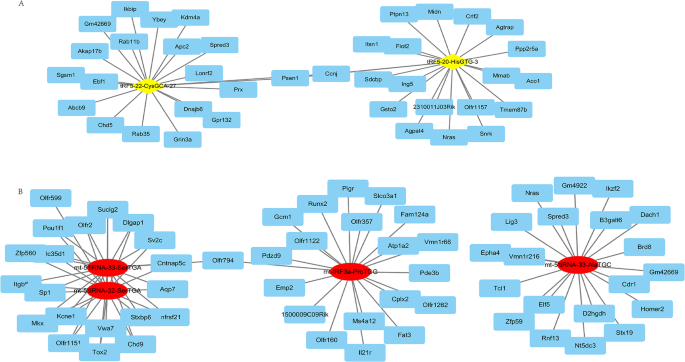
The co-expression network of the top 20 target genes and the up tsRNA(A) and the down tsRNA(B). A: The co-expression network of the top 20 target genes and the up tsRNA; B: The co-expression network of the top 20 target genes and the down tsRNA.


